|
|
#15. EnergyEnergy can be loosely defined as anything able to turn a machine.Electricity moves the wheels of both watches and railroad engines, heat turns the steam turbines in power stations, the chemical energy of gasoline runs a car--all these are forms of energy. Light is energy, too--a solar cell converts it to electricity, and green plants convert it to chemical energy. A grandfather clock is powered by weights descending from a higher level--that is "potential energy" (Thomas Jefferson at his home in Monticello had a 7-day clock run by hanging cannonballs). Speed of motion is "kinetic energy", like the energy of a turning flywheel or of the wind hitting a windmill, both of which can move machinery. And it takes energy to set up a magnetic field--even when the source is an electric current which meets no resistance, like the Earth's ring current.
The Flow of Energy to the MagnetosphereEnergy in physics is like money in society--a universal currency in which any physical process in nature must be paid for. A fundamental law of physics asserts that it is never lost or gained, only changed from one form to another. Both the fast-moving ions of the outer radiation belt and the fast electrons which produce the aurora contain appreciable kinetic energy, which must be supplied from somewhere.The ultimate source is the Sun. Nuclear processes in its core convert hydrogen to helium and produce heat, which flows to the Sun's surface. Most of the heat of the surface layers is then radiated away as sunlight, which sustains life on Earth, but a small part ends up heating the outermost layer of the Sun, the corona, to a million-degree temperature. As the hot gas of the corona--a plasma, really--expands upwards, its heat is converted to the kinetic energy of a fast flow, streaming outwards: the solar wind. Four or five days after leaving the Sun, solar wind plasma hits the magnetosphere, an obstacle in its path. As it flows around that obstacle, some kinetic energy is withdrawn, ultimately powering the aurora and a variety of other processes. The above is the basic chain by which energy reaches the magnetosphere. Many links however remain obscure: Why is the corona so hot? How is solar wind energy transmitted to the magnetosphere? How are particles injected into the inner magnetosphere during magnetic storms? There exist clues, theories and observations, but only partial understanding.
|
|
Further Exploring The sister-site of "Exploration," "From Stargazers to Starships," contains a detailed discussion of physics and of solar physics. It contains much more about energy and more about energy generation by the Sun--but be warned, what you will find is a rather extensive and detailed exposition!
|
------------------------------------------------------------
#16. The SunSize and DistanceThe Sun is our nearest star and the source of energy for life on Earth. It is about 150 million km away (93 million miles), a distance which sunlight covers in 8 minutes, whereas the distance to the moon is only 1.3 light-seconds. The Sun is about 300,000 times heavier than Earth and rotates around its axis (as viewed from the orbiting Earth) in about 27 days. |
|
|
|
Click here for a detailed exposition on the Sun, by Bill Arnett.
Next Stop: #16H. The Sun--History
------------------------------------------------------------
#16H. The Sun -- HistoryLarge sunspots may be occasionally seen by the unaided eye, with the sun near the horizon and dimmed by thick haze. Early observations of this sort exist, but not much was remembered of them, and when around 1610 they were seen more clearly with the help of the telescope, the discovery came as a great surprise.Three observers claimed the discovery--Galileo, who risked blindness by looking at the Sun through a telescope, the priest Christopher Scheiner in Germany, who invented the safe observing method of projecting the Sun's image onto a screen, and Johann Fabricius in Holland. After the initial studies, however, interest in sunspots declined, in part because (for reasons still not known) they almost disappeared between 1645 and 1715.
Ultimately, however, Schwabe's article caught the eye of Alexander von Humboldt, tireless promoter of the sciences, who in 1851 published Schwabe's table (updated to 1850) in his encyclopaedic compilation of natural science, "Kosmos." After that scientists all over the world became interested in the 11-year sunspot cycle. Some, led by Rudolf Wolf, examined old records to reconstruct earlier sunspot cycles, while Edward Sabine in England in 1852 found a similar periodicity in magnetic storms. Some more speculative minds also claimed (and still do) an 11-year period in weather patterns, or even in the outbreaks of wars and epidemics.
 Sunspot Cycle (1850 - 1975)
FlaresOne who was greatly influenced by Schwabe's discovery was an English gentleman of independent means, Richard Christopher Carrington, who devoted himself to the study of sunspots. His work, extending from 1853 to 1861, was collected in "Observation of the Spots of the Sun" [1863], a book described by Harold W. Newton as "a classic studied with feelings of admiration by all sunspot observers." Carrington was busily observing a prominent group of sunspots on September 1, 1859, when suddenly "two patches of intensely bright and white light broke out." The patches brightened rapidly and then decayed again (click here for his description) and by good chance, the observation was confirmed by another English astronomer.Carrington had seen a flare, of the rare variety that is visible in white light (only about 50 are known). No more than 17 hours later a great magnetic storm erupted, with aurora seen as far as Cuba. Carrington noted the connection, but cautioned that "one swallow does not make a summer." In 1892 George Ellery Hale--founder of the great astronomical observatories on Mt. Wilson and later on Mt. Palomar--devised the spectroheliograph, an instrument scanning the Sun in a narrow range of color emitted by a certain atom ("spectral line"). In July of that year he used it to observe two large flares, followed (19.5 and 30 hours later, respectively) by big magnetic storms. Hale also tuned his instrument to spectral lines known to change when produced in strong magnetic fields, and concluded in 1908 that sunspots were intensely magnetic. That fit nicely with observations during total eclipses of the Sun, when streaks above sunspot areas were often seen to arch above the Sun's edge like field lines of a bar magnet. After World War II scientists began monitoring the cosmic radiation, the flow of high-energy ions arriving from distant space, using arrays of Geiger counters and other instruments. Starting in 1942 they occasionally saw peaks of intensity after strong flares. Flares also emit x-rays, believed to be produced by great numbers of high-energy electrons accelerated in the flare region and trapped in it. The GOES spacecraft regularly monitors such emissions, and x-ray cameras aboard satellites--e.g the Solar Maximum Mission, launched in 1980, and more recently Yohkoh, launched in 1991--have taken some remarkable flare pictures.
Coronal Mass EjectionsCoronal mass ejections (CMEs), described earlier, were observed by the space station Skylab in 1973, following earlier indications from the 7th Orbiting Solar Observatory (OSO 7). However, nearly 20 years passed before Art Hundhausen and Jack Gosling collected convincing evidence that perhaps CMEs, rather than solar flares, may be more characteristic phenomenon of abrupt energy release. We still lack a good explanation of what propels those giant plasma clouds away from the Sun.
|
Next Stop: #17. Ths Sun's Corona
------------------------------------------------------------
#16a. Discovery of the Sunspot CycleExcerpts from Solar Observations During 1843 by Heinrich Schwabe, (Astronomische Nachrichten, vol. 20., no. 495, 1843)The weather throughout this year was so extremely favorable that I have been able to observe the Sun clearly on 312 days; however, I counted only 34 groups of sunspots....From my earlier observations, which I have reported every year in this journal, it appears that there is a certain periodicity in the appearance of sunspots and this theory seems more and more probable from the results of this year. ...I should like now to add a complete report of all my observations of sunspots up to the present, in which I have indicated the number of days of observation and the days when there were no spots to be seen, as well as the number of groups.
|
| Year | No. of Clusters | Days when no Spots were observed | Observation Days |
| 1826 | 118 | 22 | 277 |
| 1827 | 161 | 2 | 273 |
| 1828 | 225 | 0 | 282 |
| 1829 | 199 | 0 | 244 |
| 1830 | 190 | 1 | 217 |
| 1831 | 149 | 3 | 239 |
| 1832 | 84 | 49 | 270 |
| 1833 | 33 | 139 | 267 |
| 1834 | 51 | 120 | 273 |
| 1835 | 173 | 18 | 244 |
| 1836 | 272 | 0 | 200 |
| 1837 | 333 | 0 | 168 |
| 1838 | 282 | 0 | 202 |
| 1839 | 162 | 0 | 205 |
| 1840 | 152 | 3 | 263 |
| 1841 | 102 | 15 | 283 |
| 1842 | 68 | 64 | 307 |
| 1843 | 34 | 149 | 324 |
|
You can also find on the web the table of Schwabe's observations (extended to 1850) as it appeared in Humboldt's "Kosmos,"
together with a small picture of Schwabe himself. A large version of that image (but at 600K it may take a while to download) is found in a web page about Schwabe by the High Altitude Observatory in Boulder, Colorado.
|
------------------------------------------------------------
|
While engaged in the forenoon of Thursday, September 1, in taking my customary observation of the forms and positions of the solar spots, an appearance was witnessed which I believe to be exceedingly rare. The image of the sun's disk was, as usual with me, projected on to a plate of glass coated with distemper of a pale straw color, and at a distance and under a power which presented a picture of about 11 inches diameter. I had secured diagrams of all the groups and detached spots, and was engaged at the time in counting from the chronometer and recording the contacts of the spots with the cross-wires used in the observation, when within the area of the great north group (the size of which had previously excited great remark), two patches of intensely bright and white light broke out, in the positions indicated in fig. 1 ... My first impression was that by some chance a ray of light had penetrated a hole in the screen attached to the object glass, for the brilliancy was fully equal to that of direct sun-light; but by at once interrupting the current observation, and causing the image to move ... I saw I was an unprepared witness of a very different affair. I therefore noted down the time by the chronometer, and seeing the outburst to be very rapidly on the increase, and being somewhat flurried by the surprise, I hastily ran to call some one to witness the exhibition with me, and on returning within 60 seconds, was mortified to find that it was already much changed and enfeebled. Very shortly afterwards the last trace was gone. In this lapse of 5 minutes, the two patches of light traversed a space of about 35,000 miles.
|
------------------------------------------------------------
 The Sun's corona in eclipse
| During a total eclipse of the Sun, when for a few minutes the Moon completely covers the Sun's face, a glow appears around the darkened Sun--the solar corona, the Sun's outermost atmosphere.
|
|
Structures visible in the corona at such times suggest that they are shaped by magnetic fields, and therefore, that the corona consists of plasma. For instance, short "plumes" rising from the polar regions of the Sun look very much like field lines coming out of the end of a bar magnet, and they therefore suggest that the Sun, in addition to the intense fields of sunspots, also has a global magnetic field like the Earth's.
|  Arches above the Sun's surface |
|
Structures observed in the corona above sunspots often have horseshoe-shaped outlines, again suggesting that they follow magnetic field lines. From the tops of such "arches" long streamers may extend, to distances of the Sun's diameter or even more, looking like pulled taffy, as if some process was pulling material away from the tops of the arches into space, (which is of course what the solar wind actually does). Astronomers have named them "helmet streamers" because of their resemblance to spiked helmets worn by knights (and also to those used by some German soldiers up to 1918).
The High Temperature of the CoronaThe most remarkable aspect of the corona is its high temperature, deduced by the Swedish astronomer Bengt Edlen in 1942 after a study of the corona's light. Much of that is sunlight scattered by coronal dust, but some light is also produced by the corona itself, in narrowly defined colors ("spectral lines") characteristic of its emitting atoms. In the 19th century, some of the spectral lines of sunlight did not match the lines of any substance on Earth, and it was proposed that they came from a new unknown chemical element, named helium (from the Greek helios--Sun). Later, in 1895, Norman Ramsey actually discovered helium on Earth.Unknown spectral lines emitted by the corona were similarly credited to a new element "coronium" until Edlen showed that they came from the familiar atoms of iron, nickel and calcium, after they had lost an appreciable number of electrons (e.g. 13 or 14 for iron). Such high levels of ionization require the atoms to be buffeted around by extremely high temperatures, around 1,000,000 C (1,800,000 F). The source of the corona's heat remains a puzzle. It is almost certain that its energy comes from the Sun's internal furnace, which also supplies the rest of the Sun's heat. However, as a rule, temperatures are expected to drop the further one gets from the furnace, whereas the million-degree corona lies outside the surface layer where sunlight originates, whose temperature is less that 6000 C.
|
|
The corona has been observed in these wavelengths by, among others, the space station Skylab in 1973-4 and more recently by the Japanese spacecraft Yohkoh, which provided the picture shown below. The corona in such pictures appears quite uneven. It is brightest near sunspots, whose arched field lines apparently hamper the outflow of solar wind which carries away energy and helps cool the corona. It is darker in "coronal holes" in between, where field lines apparently extend out to distant space, making it easier for the solar wind to escape.
|
|
|
A more detailed discussion of solar observations in x-rays, titled "Seeing the Sun in a New Light," can be found in the sister-site "From Stargazers to Starships."
|
Next Stop: #18. The Solar Wind
------------------------------------------------------------
|
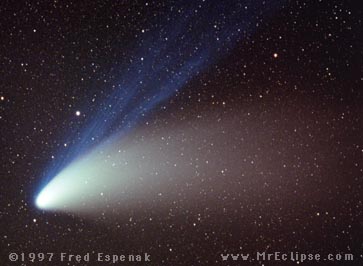
The first indication that the sun might be emitting a "wind" came from comet tails, observed to point away from the Sun, whether the comet was approaching the Sun or whether it was moving away. Kepler in the early 1600s guessed that those tails were driven by the pressure of sunlight, and his guess still holds true for the many comet tails which consist of dust.
|
|
|
|
Sunlight pressure cannot explain such behavior, but in 1943 Cuno Hoffmeister in Germany, and later Ludwig Biermann, proposed that apart from sunlight, the Sun also emitted a steady stream of particles, a "solar corpuscular radiation" which pushed the ions. Variations in the speed of the particles would explain the accelerations, and the tail did not point straight away from the Sun because the flow velocity of the particles was not too many times larger than the velocity of the comet itself.
Parker's TheoryNo one gave a good reason why this "particle radiation" should exist, until Eugene Parker of the University of Chicago in 1958 tried to derive the equilibrium structure of the corona. One expects the corona at great distances to dwindle away to zero pressure and density, but Parker found that the conduction of heat interfered with such an equilibrium and instead another solution suggested itself, in which the topmost layers of the corona flowed away from the Sun at a velocity like that of Biermann's "corpuscular radiation." The flow was named "solar wind" and its existence was later confirmed by instruments aboard spacecraft.The solar wind shapes the Earth's magnetosphere and supplies energy to its many processes. Its density at the Earth's orbit is around 6 ions per cubic centimeter--far, far less than that of the "best vacuum" obtainable in labs on Earth. The distribution of ions in the solar wind generally resembles the distribution of elements on the Sun-- mostly protons, with 5% helium and smaller fractions of oxygen and other elements. (There are electrons too, of course, counteracting the positive charge of the ions and keeping the plasma electrically neutral.) All this flows away from the Sun with a mean speed of about 400 km/sec, and as shown by the Voyager 2 space probe, this flow extends past the outermost planets, more than 30 times more distant from the Sun than Earth, and it probably continues much further than that.
If the energy of the magnetic field is dominant, its field lines keep their shapes and particle motion must conform to them; that is what happens in the radiation belts. On the other hand, if the energy of the particles is dominant--that is, if the field is weak and the particles dense--the motion of the particles is only slightly affected, whereas the field lines are bent and dragged to follow that motion. That is the case with the solar wind.
Imagine a field line extending from the bulk of the Sun to the upper corona. The particles at its "roots" stay with the Sun, but those in the high corona flow out with the solar wind, to the Earth's orbit and far beyond. All that time (under ideal conditions--a fair approximation) the same field line continues to link both groups. Thus some solar field lines will extend to the Earth and further out, producing the interplanetary magnetic field (IMF). It is the IMF that allows the solar wind to "pick up" the ions in a comet's ion tail, as it also did to an "artificial comet" produced in a 1985 experiment (see positive ions, "clouds of barium ions"). As will be seen, the IMF plays a major role in linking the magnetosphere to the solar wind.
|
|
Further Exploring The sister-site "From Stargazers to Starships" which also discusses the Sun and the solar wind, includes an optional section for deriving and drawing the shape of interplanetary magnetic field lines, using the concept of field-line preservation. That section was added to "Exploration" and it is linked here. |
Next Stop: #18H. The Solar Wind--History
------------------------------------------------------------
|
The Law of Field Line Preservation When a spacecraft breaks away from the influence of the Earth's magnetic field into interplanetary space, it finds there a weak magnetic field. The field may be weak, but it extends over huge distances, and can have important effects. From the observed direction of interplanetary magnetic field lines, we believe this field comes from the Sun, carried by magnetic field lines dragged out by the solar wind. |
|
|
When some process moves plasma inside a magnetic field, what happens depends of the relative strength of the two. If the magnetic field is strong--as happens in the corona, close to the Sun--then it dominates, and determines where the plasma can or cannot go. That is why magnetic field-line loops tend to keep back the solar wind, unlike the outward-bound lines in the "coronal holes" between them. But if the field is weak, then the plasma rules and pushes the field lines around. A rule which is fairly well obeyed states then that if two or more ions start out located on the same field line, they will always share the same field line. If they then manage to move, the field line gets deformed.
|
|
Drawing Interplanetary Field lines Using this "law of field line preservation", we will now derive the shape of interplanetary magnetic field lines.
On that line mark points at distances 15/16", 2" and 3 3/8" on both sides of the y-axis, then draw radial lines from the center of the Sun through those points, extending them until they are 1/2" from the sides of the sheet or 1" from the top. For those used to metric units, let the radius of the Sun be 1 cm (diameter=2cm), the pencil line follows y=10 cm and the marks on it are at distances of approximately 23.7, 50.2 and 83.9 millimeters from the y-axis. Extend the lines until they reach within 1 cm of the sides or 3 cm of the top.)
Marking the Spokes
Spiral field lines
|
Postscript, 17 November 1999As noted at the beginning, two extreme modes exist in the interaction between a plasma and a magnetic field. If the plasma is rarefied, even if its particles have high energy, its motion is guided and channelled by magnetic field lines. On the other hand, if the plasma is dense and the magnetic field relatively weak--the situation in most of interplanetary space--instead of the magnetic field deforming the plasma's motion, that motion deforms the magnetic field.It was also noted that with increasing distance from the Sun, the spiral shape of interplanetary magnetic field lines becomes more and more tightly wound, until their shape differs little from circles. Both points were well illustrated by the phenomena that followed intense solar activity in April-May 1998, reported by Robert Decker of the Applied Physics Lab of the Johns Hopkins University in Maryland. That activity created a disturbance in the solar wind, as well as a flow of protons with energies about 1000 times that of the solar wind, and these were observed by a number of spacecraft--ACE at the L1 Lagrangian point (near Earth, distance from the Sun about 1 AU), by Ulysses (5 AU), and by Voyagers 1-2--Voyager 2 at 56 AU and Voyager 1 at 72 AU. The solar wind disturbance arrived at Voyager 1 about 7.5 months later, propagating radially at the velocity of the solar wind flow in which it was embedded. The protons, on the other hand, although they moved much faster, were relatively few in number, which forced them to spiral along field lines. They were observed by Voyager 1 after 6 months--1.5 months before the disturbance in the solar wind reached that distance--and Dr. Decker calculated that their spiral path took them 10 times around the Sun, a total distance of about 2000 AU.
|
Solar Wind History: #18H TheSolar Wind--History
------------------------------------------------------------
Not everyone accepted Parker's theory of the solar wind when it was first published in 1958, and it was debated until observations confirmed it:
The top graph below shows the variations in the speed of the solar wind as seen by Mariner 2: the values fluctuate from 400 to 700 km/sec. The bottom graph shows variations in the "storminess" of the Earth's magnetic field, which obviously goes up and down in a similar way.
|
| The sources of the fast streams were later found to be the "coronal holes" studied in 1973-4 from the space station Skylab. In sunspot regions field lines form arches which hold back the solar wind, but in the "holes" in between they extend outwards and allow the plasma to accelerate unimpeded. Lower-velocity solar wind comes from regions in between sunspot regions and coronal holes
|
UlyssesThe polar regions of the Sun also have such outwards-directed field lines, as evidenced by the "polar plumes" seen in the corona during a total eclipse of the Sun. It was therefore expected that the solar wind above the Sun's poles would be relatively fast and smooth-flowing. A mission to that region had been planned since the 1970s, and it led after many delays and cutbacks to the spacecraft Ulysses (Latin name of Odysseus), a joint European-NASA venture. Ulysses passed above the Sun's south pole in September 1994, and above the north pole in 1995.All planetary orbits lie approximately in the same flat plane as that of the Earth ("plane of the ecliptic"), which is also close to the Sun's equatorial plane. To reach a position above the Sun's pole, Ulysses needed to be flung out of this plane, and it did so by first flying out to the planet Jupiter and then using that planet's gravity as a pivot while swinging into the third dimension. Ulysses has confirmed the existence of a steady fast-flowing solar wind above the poles and has observed many interesting phenomena associated with it. The Ulysses mission has its own home page on the web, leading to many related files. To reach it, click here.
|
Next Stop: #19. The Magnetopause
Authors and Curators:
This joined-up file created 10 June 2001